All posts by Amit Tewari

A Tour of Machine Learning Algorithms

Link to Machine Learning Mastery: A tour of machine learning algorithms

After we understand the type of machine learning problem we are working with, we can think about the type of data to collect and the types of machine learning algorithms we can try. In this post we take a tour of the most popular machine learning algorithms. It is useful to tour the main algorithms to get a general idea of what methods are available.

There are so many algorithms available. The difficulty is that there are classes of method and there are extensions to methods and it quickly becomes very difficult to determine what constitutes a canonical algorithm. In this post I want to give you two ways to think about and categorize the algorithms you may come across in the field.

The first is a grouping of algorithms by the learning style. The second is a grouping of algorithms by similarity in form or function (like grouping similar animals together). Both approaches are useful.

Learning Style

There are different ways an algorithm can model a problem based on its interaction with the experience or environment or whatever we want to call the input data. It is popular in machine learning and artificial intelligence text books to first consider the learning styles that an algorithm can adopt.

There are only a few main learning styles or learning models that an algorithm can have and we’ll go through them here with a few examples of algorithms and problem types that they suit. This taxonomy or way of organizing machine learning algorithms is useful because it forces you to think about the the roles of the input data and the model preparation process and select one that is the most appropriate for your problem in order to get the best result.

  • Supervised Learning: Input data is called training data and has a known label or result such as spam/not-spam or a stock price at a time. A model is prepared through a training process where it is required to make predictions and is corrected when those predictions are wrong. The training process continues until the model achieves a desired level of accuracy on the training data. Example problems are classification and regression. Example algorithms are Logistic Regression and the Back Propagation Neural Network.
  • Unsupervised Learning: Input data is not labelled and does not have a known result. A model is prepared by deducing structures present in the input data. Example problems are association rule learning and clustering. Example algorithms are the Apriori algorithm and k-means.
  • Semi-Supervised Learning: Input data is a mixture of labelled and unlabelled examples. There is a desired prediction problem but the model must learn the structures to organize the data as well as make predictions. Example problems are classification and regression. Example algorithms are extensions to other flexible methods that make assumptions about how to model the unlabelled data.
  • Reinforcement Learning: Input data is provided as stimulus to a model from an environment to which the model must respond and react. Feedback is provided not from of a teaching process as in supervised learning, but as punishments and rewards in the environment. Example problems are systems and robot control. Example algorithms are Q-learning and Temporal difference learning.

When crunching data to model business decisions, you are most typically using supervised and unsupervised learning methods. A hot topic at the moment is semi-supervised learning methods in areas such as image classification where there are large datasets with very few labelled examples. Reinforcement learning is more likely to turn up in robotic control and other control systems development.

Algorithm Similarity

Algorithms are universally presented in groups by similarity in terms of function or form. For example, tree based methods, and neural network inspired methods. This is a useful grouping method, but it is not perfect. There are still algorithms that could just as easily fit into multiple categories like Learning Vector Quantization that is both a neural network inspired method and an instance-based method. There are also categories that have the same name that describes the problem and the class of algorithm such as Regression and Clustering. As such, you will see variations on the way algorithms are grouped depending on the source you check. Like machine learning algorithms themselves, there is no perfect model, just a good enough model.

In this section I list many of the popular machine leaning algorithms grouped the way I think is the most intuitive. It is not exhaustive in either the groups or the algorithms, but I think it is representative and will be useful to you to get an idea of the lay of the land. If you know of an algorithm or a group of algorithms not listed, put it in the comments and share it with us. Let’s dive in.

Regression

Regression is concerned with modelling the relationship between variables that is iteratively refined using a measure of error in the predictions made by the model. Regression methods are a work horse of statistics and have been cooped into statistical machine learning. This may be confusing because we can use regression to refer to the class of problem and the class of algorithm. Really, regression is a process. Some example algorithms are:

  • Ordinary Least Squares
  • Logistic Regression
  • Stepwise Regression
  • Multivariate Adaptive Regression Splines (MARS)
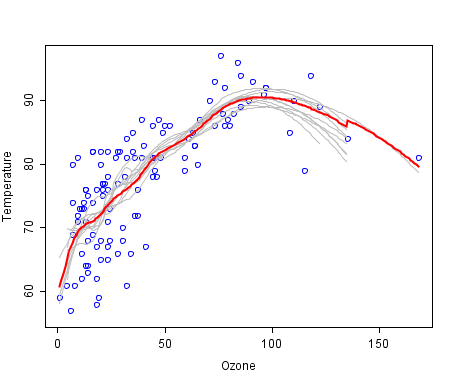
  • Locally Estimated Scatterplot Smoothing (LOESS)

Instance-based Methods

Instance based learning model a decision problem with instances or examples of training data that are deemed important or required to the model. Such methods typically build up a database of example data and compare new data to the database using a similarity measure in order to find the best match and make a prediction. For this reason, instance-based methods are also called winner-take all methods and memory-based learning. Focus is put on representation of the stored instances and similarity measures used between instances.

  • k-Nearest Neighbour (kNN)
  • Learning Vector Quantization (LVQ)
  • Self-Organizing Map (SOM)

Regularization Methods

An extension made to another method (typically regression methods) that penalizes models based on their complexity, favoring simpler models that are also better at generalizing. I have listed Regularization methods here because they are popular, powerful and generally simple modifications made to other methods.

  • Ridge Regression
  • Least Absolute Shrinkage and Selection Operator (LASSO)
  • Elastic Net

Decision Tree Learning

Decision tree methods construct a model of decisions made based on actual values of attributes in the data. Decisions fork in tree structures until a prediction decision is made for a given record. Decision trees are trained on data for classification and regression problems.

  • Classification and Regression Tree (CART)
  • Iterative Dichotomiser 3 (ID3)
  • C4.5
  • Chi-squared Automatic Interaction Detection (CHAID)
  • Decision Stump
  • Random Forest
  • Multivariate Adaptive Regression Splines (MARS)
  • Gradient Boosting Machines (GBM)

Bayesian

Bayesian methods are those that are explicitly apply Bayes’ Theorem for problems such as classification and regression.

  • Naive Bayes
  • Averaged One-Dependence Estimators (AODE)
  • Bayesian Belief Network (BBN)

Kernel Methods

Kernel Methods are best known for the popular method Support Vector Machines which is really a constellation of methods in and of itself. Kernel Methods are concerned with mapping input data into a higher dimensional vector space where some classification or regression problems are easier to model.

  • Support Vector Machines (SVM)
  • Radial Basis Function (RBF)
  • Linear Discriminant Analysis (LDA)

Clustering Methods

Clustering, like regression describes the class of problem and the class of methods. Clustering methods are typically organized by the modelling approaches such as centroid-based and hierarchal. All methods are concerned with using the inherent structures in the data to best organize the data into groups of maximum commonality.

  • k-Means
  • Expectation Maximisation (EM)

Association Rule Learning

Association rule learning are methods that extract rules that best explain observed relationships between variables in data. These rules can discover important and commercially useful associations in large multidimensional datasets that can be exploited by an organisation.

  • Apriori algorithm
  • Eclat algorithm

Artificial Neural Networks

Artificial Neural Networks are models that are inspired by the structure and/or function of biological neural networks. They are a class of pattern matching that are commonly used for regression and classification problems but are really an enormous subfield comprised of hundreds of algorithms and variations for all manner of problem types. Some of the classically popular methods include (I have separated Deep Learning from this category):

  • Perceptron
  • Back-Propagation
  • Hopfield Network
  • Self-Organizing Map (SOM)
  • Learning Vector Quantization (LVQ)

Deep Learning

Deep Learning methods are a modern update to Artificial Neural Networks that exploit abundant cheap computation. They are concerned with building much larger and more complex neural networks, and as commented above, many methods are concerned with semi-supervised learning problems where large datasets contain very little labelled data.

  • Restricted Boltzmann Machine (RBM)
  • Deep Belief Networks (DBN)
  • Convolutional Network
  • Stacked Auto-encoders

Dimensionality Reduction

Like clustering methods, Dimensionality Reduction seek and exploit the inherent structure in the data, but in this case in an unsupervised manner or order to summarise or describe data using less information. This can be useful to visualize dimensional data or to simplify data which can then be used in a supervized learning method.

  • Principal Component Analysis (PCA)
  • Partial Least Squares Regression (PLS)
  • Sammon Mapping
  • Multidimensional Scaling (MDS)
  • Projection Pursuit

Ensemble Methods

Ensemble methods are models composed of multiple weaker models that are independently trained and whose predictions are combined in some way to make the overall prediction. Much effort is put into what types of weak learners to combine and the ways in which to combine them. This is a very powerful class of techniques and as such is very popular.

  • Boosting
  • Bootstrapped Aggregation (Bagging)
  • AdaBoost
  • Stacked Generalization (blending)
  • Gradient Boosting Machines (GBM)
  • Random Forest

Ensemble Learning Method

Resources

This tour of machine learning algorithms was intended to give you an overview of what is out there and some tools to relate algorithms that you may come across to each other.

The resources for this post are as you would expect, other great lists of machine learning algorithms. Try not to feel overwhelmed. It is useful to know about many algorithms, but it is also useful to be effective and have a deep knowledge of just a few key methods.

I hope you have found this tour useful. Leave a comment if you know of a better way to think about organizing algorithms or if you know of any other great lists of machine learning algorithms.

For more information about MoData offerings click here

Modeling the Probability of Winning an NFL Game

Priceonomics: Modeling the Probability of Winning an NFL Game

If you’re watching a sporting event, at any given time there is a probability your team will win or lose. If your team is ahead by a lot, they’ll probably end up winning. If the opposite case is true, they’ll probably lose. If the Vegas odds are in favor of your team, that matters (but only at the beginning of the game). If your team has possession of the ball, that matters too.

During this year’s NFL playoff’s we had a great picture of how these probabilities unfolded when the Indianapolis Colts ended defeating the Kansas City Chief after being down by 28 points fairly late in the game. At one point, the Chiefs had over a 99% chance of winning. They ended up losing.

The above graph shows us the 60-minute journey to the Colts’ 45-44 win two weekends ago. After a brief back-and-forth during the first quarter, the Chiefs looked like almost-guaranteed winners for most of the game. But then the Colts overcame a 28-point deficit in one of the biggest comebacks in NFL playoff history. The Win Probability model mirrored these momentum shifts.

So what is it that makes this model tick? Three major factors working in tandem:

1. Vegas Odds

Sports bookies begin each week by determining the point spread, and they decided the Colts were 2.5-point favorites. At the beginning of a game, because there is plenty of football left to be played, the odds of winning stay relatively close to what the bookies say. The Chiefs leading by 7 in the first quarter didn’t give us (or the model) enough information to pick a winner.

2. The Scoreboard

As the game progresses, though, the scoreboard becomes key. The model can tell us how likely teams in the past have been to win based on the current score and time left in the game. ESPN’s model is based on 10 years-worth of NFL play-by-play game data, which is a lot of plays. At halftime, with the Chiefs up 31-10, it calculated that they had a 96.4% chance to win. A team winning by 3 touchdowns at half is historically an almost sure pick.

3. Field Position

Towards the end of the game, as there is not much time left, a team’s chances to take the lead are more dependent on where they are on the field and who has the ball. For example, a team that is up by 3 has a much better chance of winning if they’re on the opponent’s 1-yard line than on their own 1-yard line. Why? Because, historically, being on the opponent’s 1-yard line gives a team an expected value of 6.9 points on the next play.

Brian Burke at Advanced NFL Stats puts a lot this together in an interesting chart below. Assuming the team has possession of the ball, how likely are they to win based on the current score and how much time is left.

Source: Advanced NFL Stats

In this model, you can see at team that is down by one point early in the Fourth Quarter is actually favored to win. However, that advantage disappears when there are less than seven minutes left.

All this is to say that when the Chiefs were winning by 28 points during the second half of the game, they probably should have won. But they didn’t.

 For more information about MoData offerings click here

Developing Data Products, A Methodology

Image: ‘Fries by Month’ photo by Lauren Manning 2006

What is a Data Product?

Technically speaking, a ‘data product’ is an insight or tool created out of existing or purposely acquired raw data that can be used to improve decision making, generally by clients, consumers or other organizations.

These insights may be simple, such as informing a buyer of available inventory three months into the future to help them make better purchasing plans. It may involve benchmarking, where a supplier is presented with how their service levels compare to all other suppliers. It may extend to providing consumer services, such as providing consumers a directory of all the best products.

For any organization, there is not only revenue, but competitive advantage to be gained in developing data products. Possible data products will depend on the organization’s internal systems, its customers and their customers and the mindset with regarding to sharing information up and down the value chain. Coordinating this creativity is the ‘Data Product Manager’

In this post, we provide a high level methodology for identifying and shaping data products.

Methodology for developing data products:

  1. Understand all areas of the business (especially support functions)
  2. Inventory all data in all repositories (especially in transactional systems)
  3. Catalog all insights and where those insights are being used to inform business decisions inside your organization to improve performance at all levels
  4. Understand your customer’s business and the types of decision they are making and what information they are using to inform those decisions
  5. Understand your customers customers, what do they look for and what do they value, where are their pain points
  6. Now ask the question what information do we possess that would help our customers that when added to our customers information could be used to help their customers
  7. What information might be available in the public domain that might help (social media, weather, geography etc.) whether free or paid for
  8. Is there any information that each of our customers might have that they might share with us that when aggregated might help all the customers
  9. What incentives could be put in place to get the clients to share that information
  10. Is there any application that could be offered to customers customers that would be useful

To create an example, I randomly picked an industry and a company – let’s say we’re targeting the Food Service business for this hypothetical case study and Sysco as a company who is interested in creating data products. Applying these steps, (with a little guesswork involved) to providing some abbreviated answers:

1. What is Sysco’s business

Sysco provides a food supply chain, buying wholesale from farms, food processors and other suppliers, the managing the forecasting, buying and ordering process, they will also operate warehouses and a logistics infrastructure to move food products. The support function would be quality assurance, nutrition experts, finance and sales and marketing

2. Thinking about the data that is flowing through Sysco’s systems

i) Customer: Identification details, Key personnel, transaction history (i.e. orders and order details, returns), issue history, billing (collections and recovery)
ii) Supplier: Identification details, Product data to include prices, nutritional information, transaction history (i.e. orders and order details, returns), issue history, financials
iii) Product Data: Sysco product files, price (and historical price), cost and profitability
iv) Inbound and Warehouse : Inventory data, stock movements, order history, demand forecasts and actuals
v) Outbound and Logstics: Outbound order history,
vi) Fleet information (vehicle inventory, repair and service history, routing and actual geo-location, fuel consumption), Delivery and receipt data
vii) Personnel: Staff records
viii) Sales and Marketing Data: Marketing Campaigns, prospect lists, conversions, cost and revenues
ix) Financial: General ledger, taxes and fees

3. What insights might be being produced inside of Sysco?

i) Financial: Financial ratios (gross margin, operating margin, cost of goods sold, return on assets, current ratio, inventory conversion etc.), invoice accuracy
ii) Inventory: inventory value, carrying costs, turnover, sales order fill rate, warehouse utilization, spoilage, out of stock
iii) Order Management: on time fulfillment, back orders, processing cost per order, orders processed per day
iv) Supplier performance: order accuracy, on time shipments, shipment cost per unit (case/SKU), value of supplier
v) Service delivery: order accuracy, on time shipment, returns
vi) Fleet: vehicle fill, empty running, fuel consumption, time utilization, deviation from schedule
vii) Sales: win-loss analysis, lost sales, collections, customer churn
viii) Marketing: cost per acquisition, conversion funnel
ix) Customer Service: issue tickets, time to resolution, cost per call

4. Understanding Sysco’s customers’ business

i) Typical customers are restaurants and company cafeterias serving food and catering businesses
ii) They are ordering and preparing food (as a finished product based on raw materials supplied by Sysco
iii) Looking to minimize their costs of delivery while maintaining high service levels and a variety of food
iv) Improving customer service levels, increasing profitability of each facility by increasing customer throughput
v) Improving menus in terms of quality and reputation
vi) Maintaining standards of hygiene
vii) Minimizing staff turnover and increasing staff productivity
viii) Reducing food costs and cost of waste or spoilage, increasing profitability of each serving

5. Understanding Sysco’s customers’ customers

i) Diners in each restaurant or cafeteria
ii) Concerned about hygiene, quality of food
iii) Want quick and efficient service in a restaurant with good ambiance
iv) Want to know that they are getting good value
v) Want to be able to find a convenient restaurant where they can find the type of food they like
vi) May have special needs in terms of food allergies, diet, children, disabled access

6. What information might we have that could help our customers and their customers?

Customers (restaurants, cafeterias, catering businesses):
i) Ordering process: typical order lead times, average order size by type and size of restaurant
ii) Menu planning: ingredients lists and proportions, quantity information per serving, price elasticities
iii) Food Information: nutritional information
iv) Delivery routing: routes by day or by hour
v) Overstocked items: advance notice of items in good supply, versus short supply
vi) Seasonal promotions: deals with food suppliers where products available at favorable prices
vii) Benchmark data: comparable orders for similar establishments

Customer’s customers (diners)
i) Nutritional information
ii) Allergy information
iii) Opening hours
iv) Menu information

7. What public domain information might be out there?

i) Restaurant directories and guides
ii) Nutritional information
iii) Allergy information
iv) Food poisoning reports
v) Restaurant hygiene inspection notes
vi) Recipe data
vii) Geo-spatial, map data of restaurants and routes

8. What information might the customers share with Sysco

i) Menus, Ingredient Lists, Recipes
ii) Diner counts / Covers per night
iii) Meal forecasts
iv) Inspection reports
v) Staff counts
vi) Staffing profiles
vii) Restaurant size (sq. footage, tables)
viii) Party booking calendars

9. What incentives might Sysco provide to encourage sharing of information

Sysco might be able to offer restaurateurs a free SaaS based restaurant planning application (calendars, ordering systems and visibility into orders placed – as offered by services such as Restaurant365Software). This would give Sysco instant access to all the aggregated data.

10. What applications might Sysco be able to provide to customer’s customers

If Sysco purchased a service such as AllMenus, then the customer’s menus could be made available directly to customers via an application. The menus could be easily enhanced with nutritional information. In addition, if Sysco purchased a service such as Foodspotting, then the menus could be linked with customer sourced ratings, photographs and reviews. In acquiring those two resources, Sysco would additional gain insight into the types of food customers were looking for and liking and a prospect list of trending restaurants.

Developing your own Data Products

At Mo-Data we are passionate about helping organizations discover new value in their data and then build the systems and processes to allow that value to be realized. Our team has been building data products for the last 10 years and has experience in Data Strategy, Business Intelligence and Insight Discovery from Big Data and from the user generated content in Social Media an addition to this, we will take care of the messy business of preparing your source data so that your analysts and data scientists can maximize the use of their skills and time.

Sysco is already supplying their clients with a huge menu of extended services such as market reports, recipe applications and chef search and perhaps there are data products there too, however,. (Neither Sysco nor any other Food Industry organization is client or prospective of Mo-Data at the time of writing)

For more information about MoData offerings click here

Adopting a Data Mindset in a Retail Organisation

Photo by Josh Hallet
The article explains how to adopt a data mindset – one of the most critical management challenges facing online retailers today.

1. What is a ‘data mindset’?
2. The data champion
3. Get more data, give more data
4. Data for continuous improvement

What is a Data Mindset?

When an organisation has a data mindset, every single person working there, from the CEO to the cleaner, uses data to inform their decisions. Agreement is required for when data should not be shared, rather than when it should. Access is easy and fast, with no need to go through IT departments and write SQL queries.

It is a fundamental shift, and there is often a real fear about the potential loss of control. Doc Searls, co-author of The Cluetrain Manifesto and author of Intention Economy, likens it to the 1980s when mainframe-centric IT departments fought against PCs being introduced and the 1990s when HR departments opposed employees gaining Internet access.

Historically, retail managers’ most significant business decisions were capital intensive with long cycle times – enter a new geography or market; build a new distribution center; or open 20 new stores. The final decision was based on careful research, usually by some expensive analysts. Today, two things have changed in the decision making process:

A) Shorter cycle times – We simply add capacity in the cloud or launch via an online marketplace. Today’s business is driven by many smaller and specific steps, each of which is measurable.

B) Cheaper cost of analysis – There are more data, more tools and more skills available to carry out analysis. Entering a new market no longer requires a market segmentation by an analyst firm and locally based advertising; today Facebook Graph advertising does it for free, in hours rather than weeks.

These same shifts in data use can be seen in Formula 1. Telematics now send back data as the car is driving, not after the race, which allows the engine to be adjusted continually throughout the race. Retail is rapidly transforming its pace of decision making in the same way.

The Data Champion

How data is thought about, gathered and used is a strategic decision for every organisation, and should be driven by a data champion from the top – but where at the top? The CIO, as the data protector, works to keep people away from the data. The CTO, responsible for the integrity of systems restricts system access. While the CFO is concerned with reporting using as little information as possible!

Many retail organisations, perhaps inspired by Amazon, have created a Chief Scientist role. This role reverses the scientific method by focusing on asking questions rather than finding answers. Answers, like data, are commodities. Being able to ask the right question is the creative element that will allow you to set your business apart. While this role is a major step forward in developing a data mindset, the Chief Scientist cannot be the data champion. The scale of cultural change requisite to become a truly data-focused organisation must come from the CEO. It’s a massive shift to make every employee customer-centric, and encourage them all to actively gather and use data to drive the business.

Get More Data

Many retailers are overwhelmed by the amount of data they have today; we argue that it’s not enough! Having a data mindset demands the continuous search for more data and more ways of using that data.

How Can You Get More Data?

• Start with your customers. Make it easy for them to tell you more. At Amazon Bezos believed in removing all barriers to contribution and so we allowed customers to write reviews without a sign-in.

Decision Intelligence. The Amazon Way: A Blueprint for Success

• Use keywords and phrases from site searches – they can help stock control and product indexing, and over time help to decide what new products to add or where money can be made running PPC advertising for other retailers.

• Review internally what technology is needed to help every part of the business contribute to the data pool. Can you install in-store cameras to examine queuing and checkout and re-deploy resources real time to minimise customer wait time? How can shrinkage be measured in the supply chain or store? Can we use predictive analytics to determine where theft is likely to occur next?

• Identify external sources of data that will provide new competitive insights. The Social Graph is a great source of data about customers and their social networks and the online advertising game is now allowing retailers to target ‘look-alike’ audiences. What would happen if adjacent retailers were able to share information in a co-optition model?

Looking outside retail, there are also plenty of businesses using data exhaust (the data produced as a by-product of another activity) to great effect. Google indexes the web and allows people to search it for free. This data exhaust is an aggregation of search words which are then used in an Adwords auction search term to advertisers. LinkedIn allows people to upload, store, update and share their CVs. This data exhaust is an aggregation of the movement of people between companies, which recruiters pay to advertise and find potential candidates.

Give More

It may feel counter-intuitive, but you should share your data with your suppliers and partners, as well as your customers. It will empower decisionmaking all along the chain.

• To suppliers: Sharing data with your supplier network will help them action improvements and optimise processes to provide a better service. For example, Walmart shares its sales data with its suppliers to help them better predict demand and be proactive in ensuring availability.

• To customers: Guide your customers buying decisions. Sears Holdings has a large base of customer data that they offer to other retailers implicitly via ShopYourWay and explicitly via Metascale. Rather than intrusive push campaigns, customers are presented with products that are relevant and perhaps outside the Sears’ assortment while they are browsing. Sears also benefits from getting feedback into their online marketplace on which new products to offer. Use your data to improve your processes

Design your processes to capture more data so that you can further improve your processes. Amazon actively harvests consumer intelligence. For example they regularly examine on-site search terms as part of the process to improve product descriptions.

If you put the right system in place, like the Social Data Intelligence Test, your products can improve directly from customer data. Customer service should be a profit centre, not a cost centre. If customer feedback data is provided quickly and easily to buyers, suppliers and designers they can respond rapidly.

Online retailers use natural feedback loops such as customer reviews and crowd-sourced support forums that allow customers to engage with them and simultaneously improve the product or experience. For instance, Sony Entertainment uses the gaming feedback boards (e.g. IGN) to determine what features customers love and hate and to work out the optimal time to launch. Google maps experienced a problem with users hacking into their system and turned this into an opportunity by opening up the system, allowing people to contribute – which has allowed for a better product.

Introducing a data mind set is a cultural shift for many retail businesses. The CEO has to introduce a programme of behavioural change where every decision and every meeting is led by data. It should be expected and indeed demanded. Early activities to get you going may include: openly acknowledging data-led successes – where has money been made or saved?; cataloguing initiatives which are explicitly data-led (either new analysis of existing data or collecting new data); or explicitly gathering and sharing widely the data generated from every new product or service launch.

This article by Andreas Weigend (Director Social Data Lab) and Gam Dias (First Retail) originally appeared in Decision Intelligence Issue 8 from Ecommera.

For more information about MoData offerings click here